 |
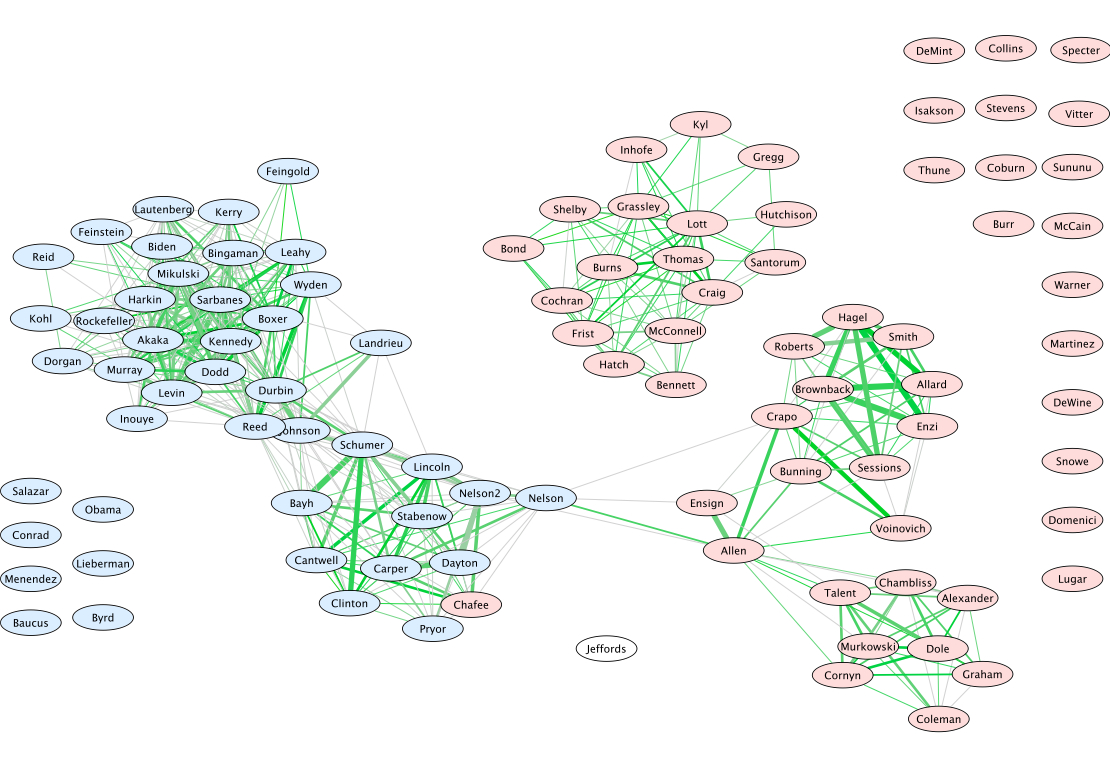
Graphical model of Senate voting 2004-2006 |
The graph shows a graphical model estimated with the sparse covariance matrix estimation method, based on the votes on 542 bills of the 100 Senators during the 2004-2006 Senate. The absence of links corresponds to conditional independence, and the presence of a path corresponds to correlation.
Method: The binary data is analyzed using a Gaussian approximation, by solving a sparse covariance matrix estimation problem. This problem corresponds to solving a maximum-likelihood problem with a penalty on the sum of the absolute values of the elements of the inverse covariance estimate.
Comments:
Links:
Data: to download the data matrix, click here.
Related software: