 Visual results from our new algorithm
Overview
To test the algorithm, we need to run it on surfaces whose
shape is accurately known. Unfortunately, it is difficult to manufacture
interesting test cases. For this reason, we have tested the algorithm
on both data collected from real objects and data generated synthetically.
The synthetic data is generated automatically from various surface
definitions by a software simulation of the videokeratograph.
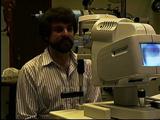
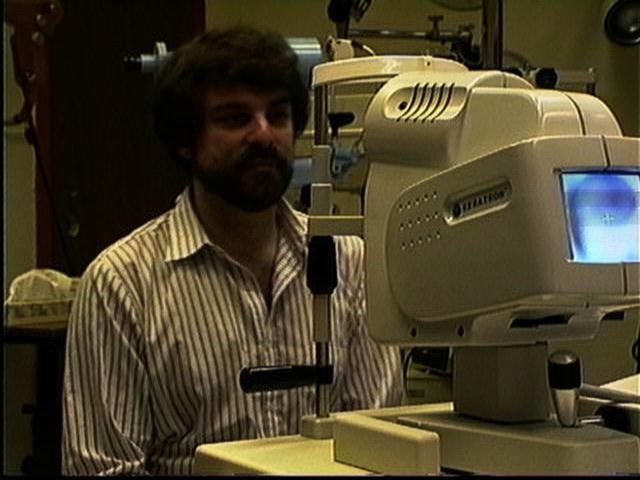
These images show some frames taken from our real-time shape analysis
system. The results of the search process are displayed to the user
after each iteration. As mentioned before, a good approximation to
the final answer is reached in a few seconds, so the user can start
analyzing the results immediately. A more accurate picture evolves
over the next few minutes.
-
Halstead, Mark A.; Barsky, Brian A.; Klein, Stanley A.; and Mandell, Robert B. (1995)
Geometric Modeling of the Cornea Using Videokeratography.
In: Daelhen, Morton; Lyche, Tom; and Schumaker, Larry L., editors.
Mathematical Methods for Curves and Surfaces.
Nashville: Vanderbilt University Press, 1995, pp. 213-223.
-
Halstead, Mark A.; Barsky, Brian A.; Klein, Stanley A.; and Mandell, Robert B. (1995)
A Spline Surface Algorithm for Reconstruction of Corneal Topography
from a Videokeratographic Reflection Pattern.
Optometry and Vision Science, Vol. 72, No. 11,
November 1995, pp. 821-827.
Available information
clicking on any picture will bring up a larger one
-
 Simulation of the algorithm on an ellipsoid
-
Simulation of the algorithm on a keratoconic surface
-
Results of the algorithm on real data
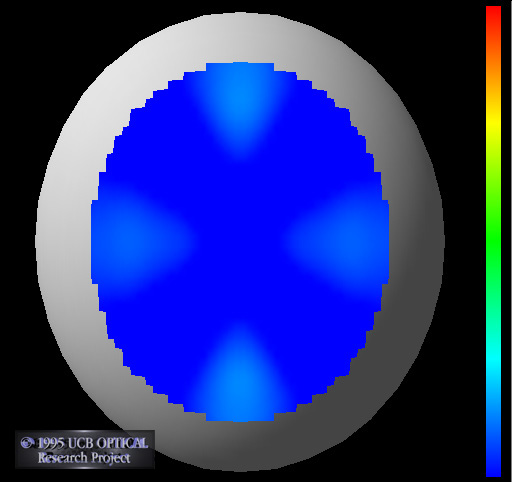
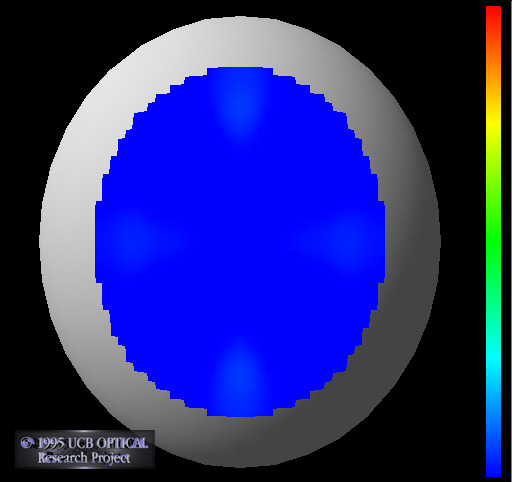
Simulation of the algorithm on an ellipsoid
Here we have four frames showing the patches
converge to a solution for a simple ellipsoid with radii of 8mm, 9mm,
and 10mm. For illustration purposes, the exact ellipsoid is also
shown. The surface colors indicate the distance between the current
solution and the exact ellipsoid. In the final frame, we can see that
good convergence has been achieved. We measure the error as the
distance in z between the two surfaces, computed at a large number
of sample points in the x,y plane. The image data for this example
was synthetically generated. The mean error in z for this example
was 9.2 x 10^{-6}mm, which is 0.0092 microns. This extremely
high accuracy is typical of all synthetic data sets we have tried.
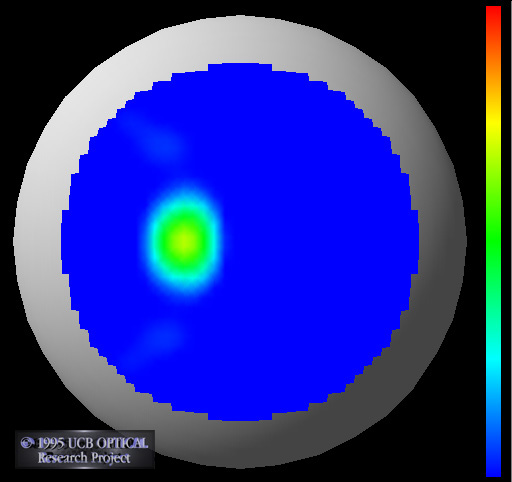
Simulation of the algorithm on a keratoconic surface
These are frames from another run of the algorithm. The data set in
this example is also synthetically generated. The aim here is to
simulate keratoconus, which is a corneal condition in which there is
local region of high curvature. The surface is generated from
a sphere with a rotationally symmetric bump grafted onto it. The bump
and the sphere meet with curvature continuity. The curvature at the
peak of the bump is significantly greater than the curvature of the
sphere. This situation has not been handled very well by the existing
measurement techniques. Our algorithm, however, has no difficulty in
finding an accurate solution. In the images below, the coloring
indicates the separation between the surface and a sphere of the same
radius as the initial test surface. This illustrates one of our
scientific visualization techniques, which is to display the surface
separation from a best-fitting ellipsoid. This enhances the
deviations so that the bump, which is positionally very close to the
sphere, becomes noticeable. In this example, we get extremely high
positional accuracy of 0.013 microns.
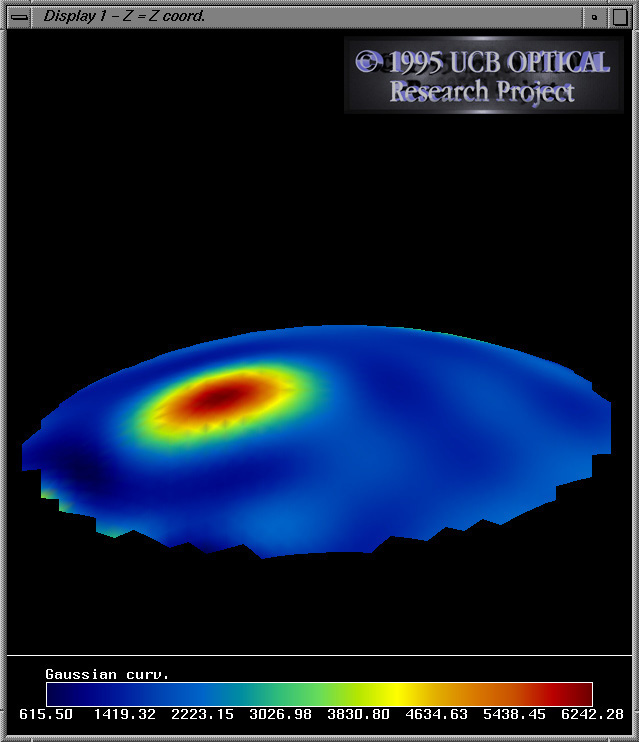
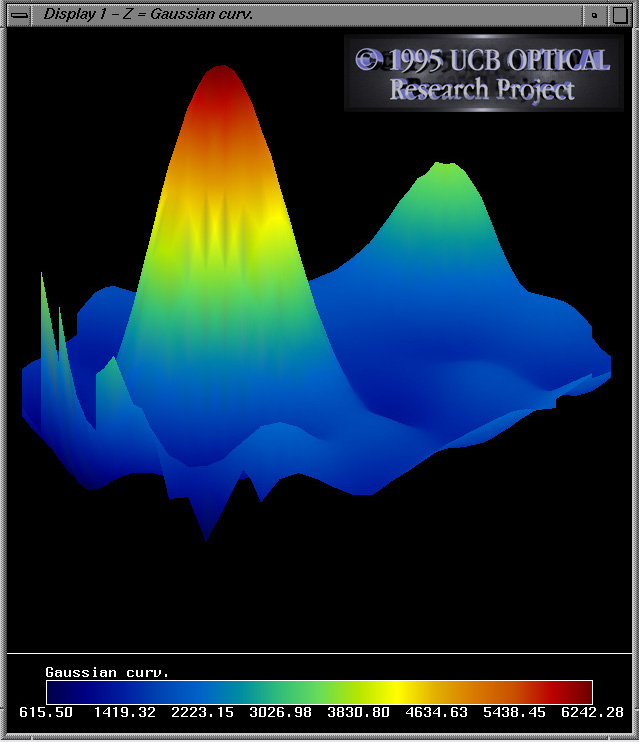
Results of the algorithm on real data
Finally, these images illustrate the results of the algorithm run on
some real data taken from a cornea. In this case, we cannot report
accuracy information because the true shape is unknown. However, we
are able to render it with our in-house visualization software
package. The six images for this figure highlight different
representations of the same dataset. For the first image, we have applied a colormap
of Gaussian curvature and encoded the height information as the true
height of the 3-D surface. The bright red spot in the lower-left
represents a local area of high Gaussian curvature. For the second image we have kept the same color
representation but changed the encoding of the height to correspond to
the Gaussian curvature; the bright red spot in the previous picture
now represents a mountain top in this image. We come full circle in
the third image and keep the same
height encoding of Gaussian curvature but change the color to
correspond to the original, true height information. This image
highlights the power of the curvature to convey subtle changes in
shape; the orange ring of equal altitude travels right through the
large local maxima of high curvature.
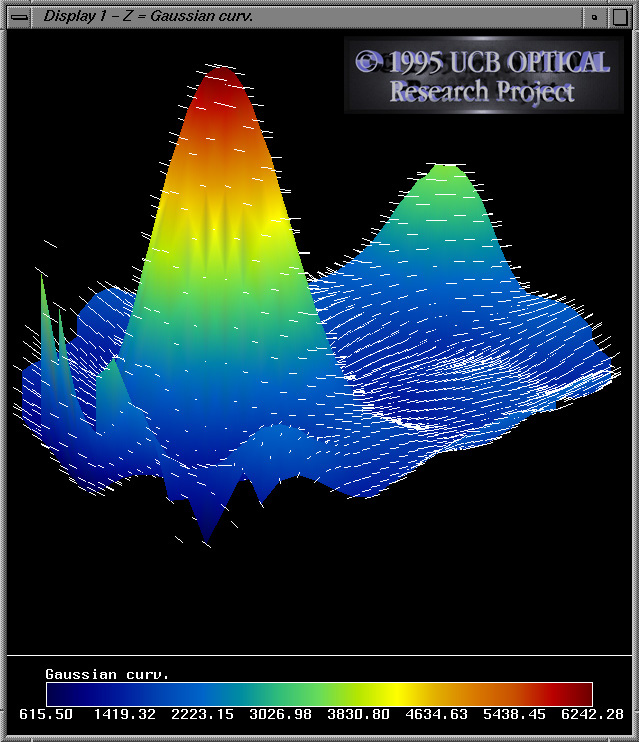
Images four through six are exactly the same as one through three, with a vector-field applied to the
surface. The vectors correspond to the direction of minimum curvature
at each point on the surface. For ruled-surface areas of gaussian
curvature surrounding high local curvature minima and maxima, these
vector field lines appear to track the way water would run off of the
surface. This is most apparent in image
5, which has this 'water-flow' effect surrounding the large, steep
peak of maximal gaussian curvature.
Copyright © 1998 OPTICAL Research Project. All rights reserved.
WWW Maven: Dan Garcia (ddgarcia@cs.berkeley.edu)  Send me feedback


 Visual results from our new algorithm